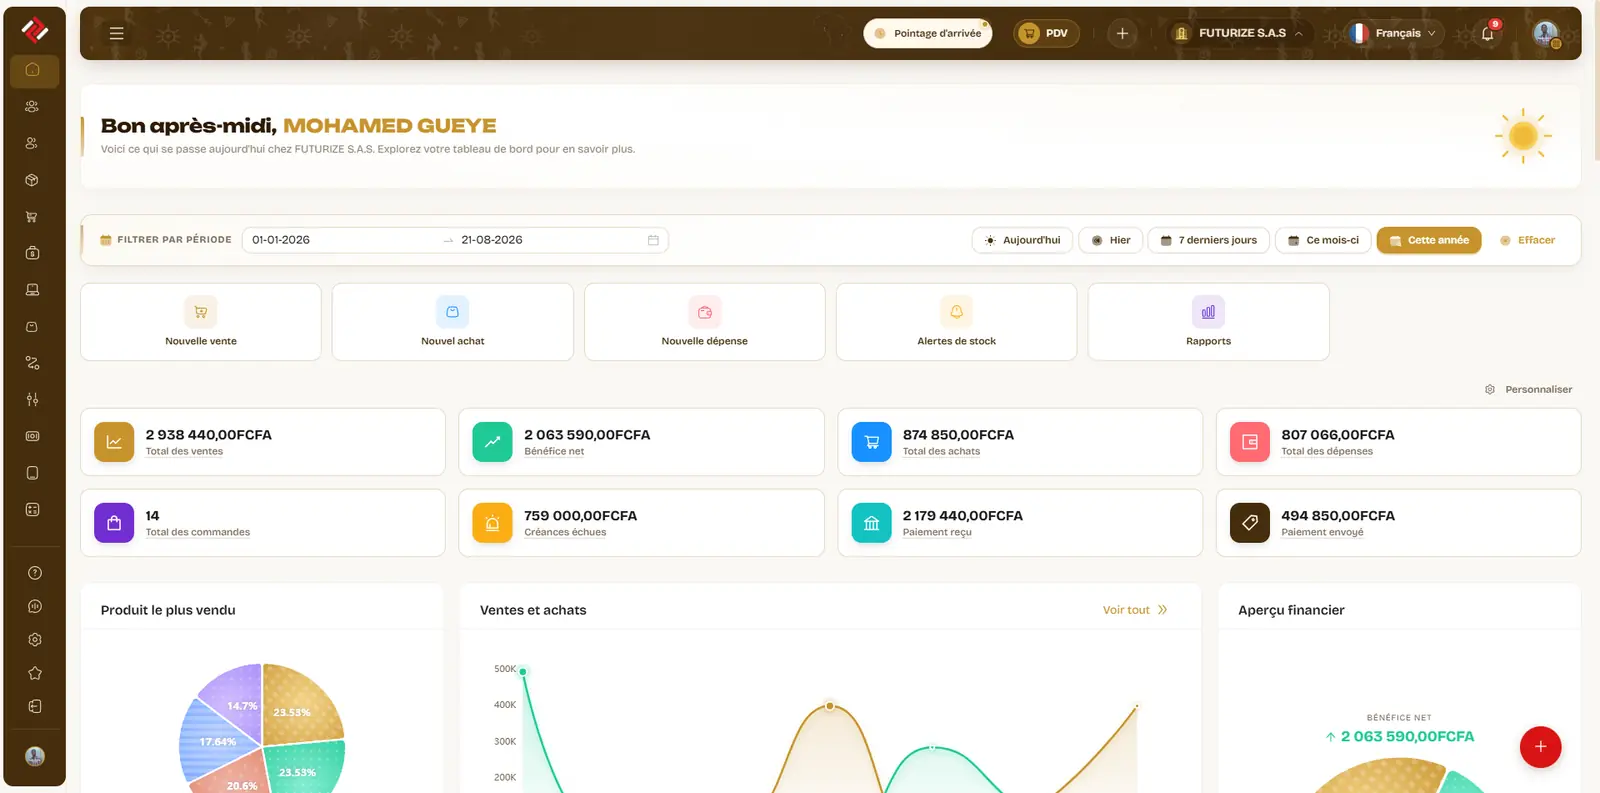
Purchase cost is known, so margin computes per product and per period with no spreadsheet.
Approaching stockouts, overdue invoices, products that stopped moving: the list comes to you.
Each report exports to Excel or PDF, with its filters and period printed on it.
What you can do with it
Quantities, turnover and margin, filterable by warehouse, category or customer.
Income, costs and result over the period, with the detail behind each line.
Valuation, turnover, threshold alerts and upcoming expiries, by warehouse.
Collections and disbursements by method, by account and by period.
Who owes what, and for how long, on the customer side as on the supplier side.
This month against last, or against the same month a year ago — the delta is shown.
How it works
-
01
Pick the period
A date range, a warehouse, a category — the filters stay visible.
-
02
Read it
Totals at the top, detail below, the comparison beside it.
-
03
Export it or act on it
Excel for the accountant, PDF for the bank, or straight into a purchase order.
What the module includes
- Payment reports
- Low-stock alerts
- Profit and loss
- Sales by product
Figures in francs, not abstract percentages
Amounts display in your company’s currency and number format, separators included — a detail that decides whether a report is read or recomputed. And period comparison respects the seasons that matter here: the Tabaski month only usefully compares with the previous Tabaski month, not with the one that just ended.
Common questions
Are the reports live?
Yes. They read trading data at the moment you open them: a sale taken two minutes ago is in there.
Who can see the margins?
Only the roles you grant permission to. Reports are governed screen by screen, like the rest of the application.
Can I get an automatic summary?
Alerts — low stock, due dates — arrive as notifications. Scheduled emailing of a full report is not available yet.